Web Inspector is the primary web debugging tool for WebKit based browsers. It allows you to inspect, tweak, debug and analyze your web page.
Remote Web Inspector UI works best on the latest Safari or Epiphany (Epiphany can be installed in Ubuntu 16.04 or later with this command: sudo apt-get install epiphany-browser).
RWI works on Chrome as well, but the UI looks distorted in some cases.
This document provides an overview of Remote Web Inspector functionality on X1 Platform Development Device.
Accessing Remote Web Inspector (RWI) from an X1 Platform Development Device
These are the generic instructions for accessing RWI from an X1 Platform Development Device.
-
Make the device routeable from your local workstation (see below for guidelines on how to connect your device).
-
Find the IP address of the device.
-
Obtain from the device diagnostics page.
-
Press and hold the
Exitbutton on the remote for 5 seconds. -
Press the
Down Down 2key sequence to display the diagnostics menu. -
Navigate to the System Debug menu page to obtain the eSTB IP address.
-
-
Connect to RWI, from your local development environment, using a modern web browser. You will connect over port 9224.
-
http://device-IPv4-Address:9224 -
If you have an IPv6 address, be sure to use brackets:
http://[device-IPv6-Address]:9224
-
Routeability
It is your responsibility to ensure that your device can successfully connect to a network and become routable to a workstation. The following brief steps have been used by developers to successfully achieve routability and may help get you up and running faster.
Local Network
In order to connect to RWI, your X1 Platform Development Device and your workstation must be connected via a wired connection to a common router or network switch.
Using a wired connection to a router
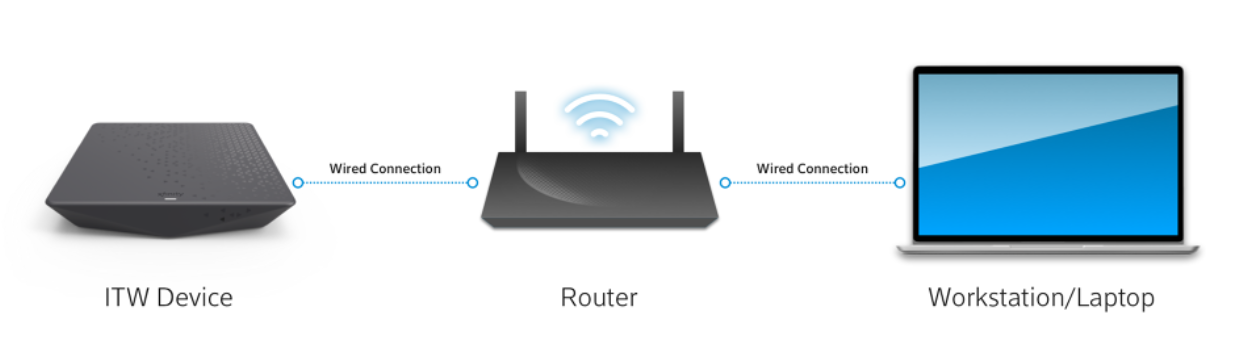
If you have physical access to your router, this method is very reliable.
-
Connect your workstation to a router
-
Connect the device the same Router
-
Refer to the generic instructions to connect to RWI
Note, using this method you can also obtain the IP address of the device from your router's administration page, but you will have to refer to manufacturer instructions to do so.
Using a network switch
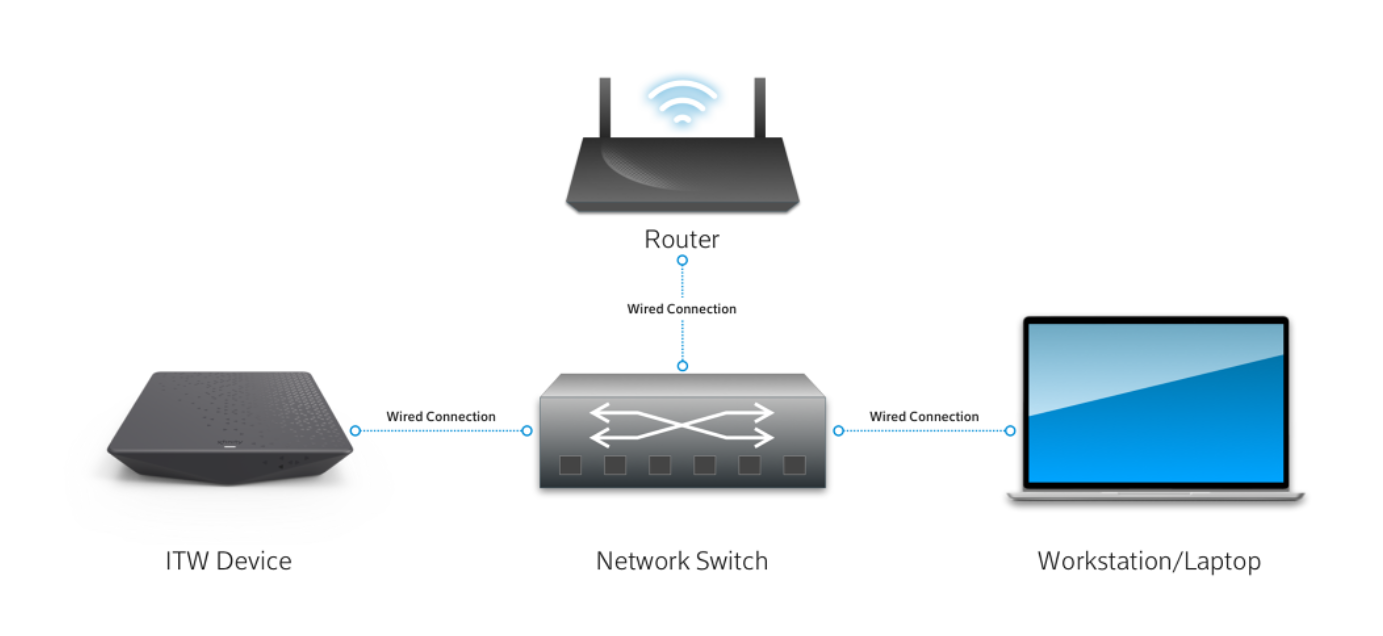
A network switch is a good option for a shared single wired connection to a router. This TP-Link switch is an example of such a device.
-
Connect your workstation to a network switch
-
Connect the device the same network
-
Connect the network switch to a router.
-
Refer to the generic instructions to connect to RWI
Using a wireless access point
Remote Web Inspector will not function over wifi. You must connect your X1 Platform Development Device and workstation to a common router or network switch via an ethernet cable.
Troubleshooting RWI Connections
Devices should be routable, but the connection to RWI is timing out
-
First, try and reboot the device 2 times. Wait a five minutes between reboots.
-
Double check the IP address of the X1 Platform Development Device. Typically, on a local network, IP addresses are dynamic, and may change.
-
Troubleshoot with your local IT department, if applicable. Some networks may have unusual configurations that won't allow this to work, out-of-the-box.
-
If you still cannot connect, reach out to your Partner Manager or contact us.
Usage
The initial Remote Web Inspector page looks like this:
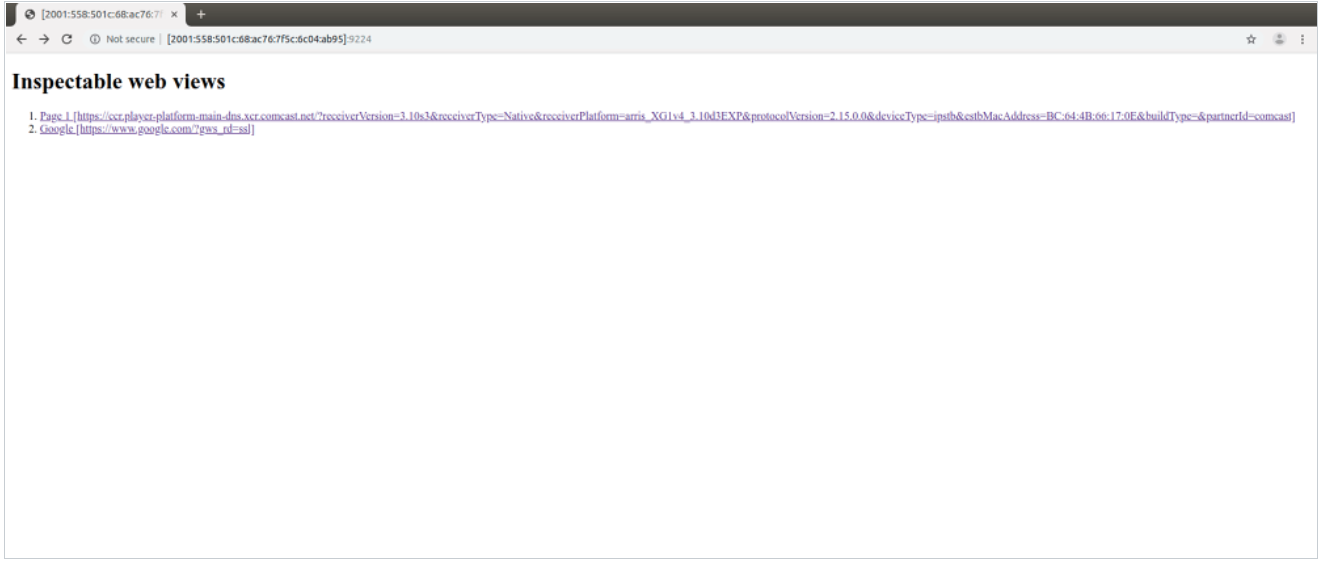
You'll need to click on the link that corresponds to the web page which you want to inspect.
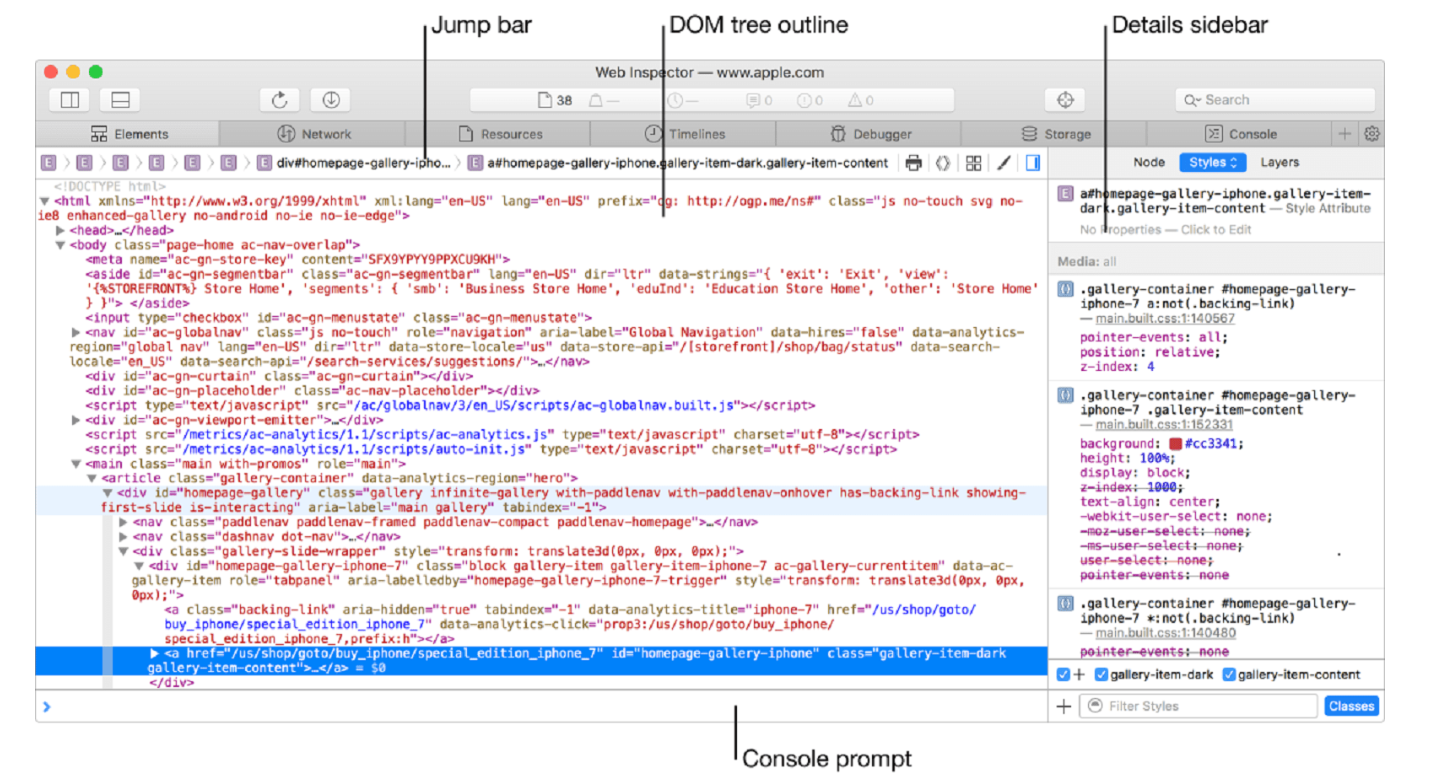
1. Elements tab:
Elements tab shows the current state of the webpage’s Document Object Model (DOM), including pseudo elements, as an editable tree outline. When a DOM element is selected in the outline, additional information about that element is available in the details sidebar.
Elements Tab
2. Network tab:
The Network tab shows all the resources that were loaded by the current webpage while Web Inspector was open. You can click the 'Reload' symbol If this tab doesn't show anything. You can see the resources list after the page reload.
Network Tab
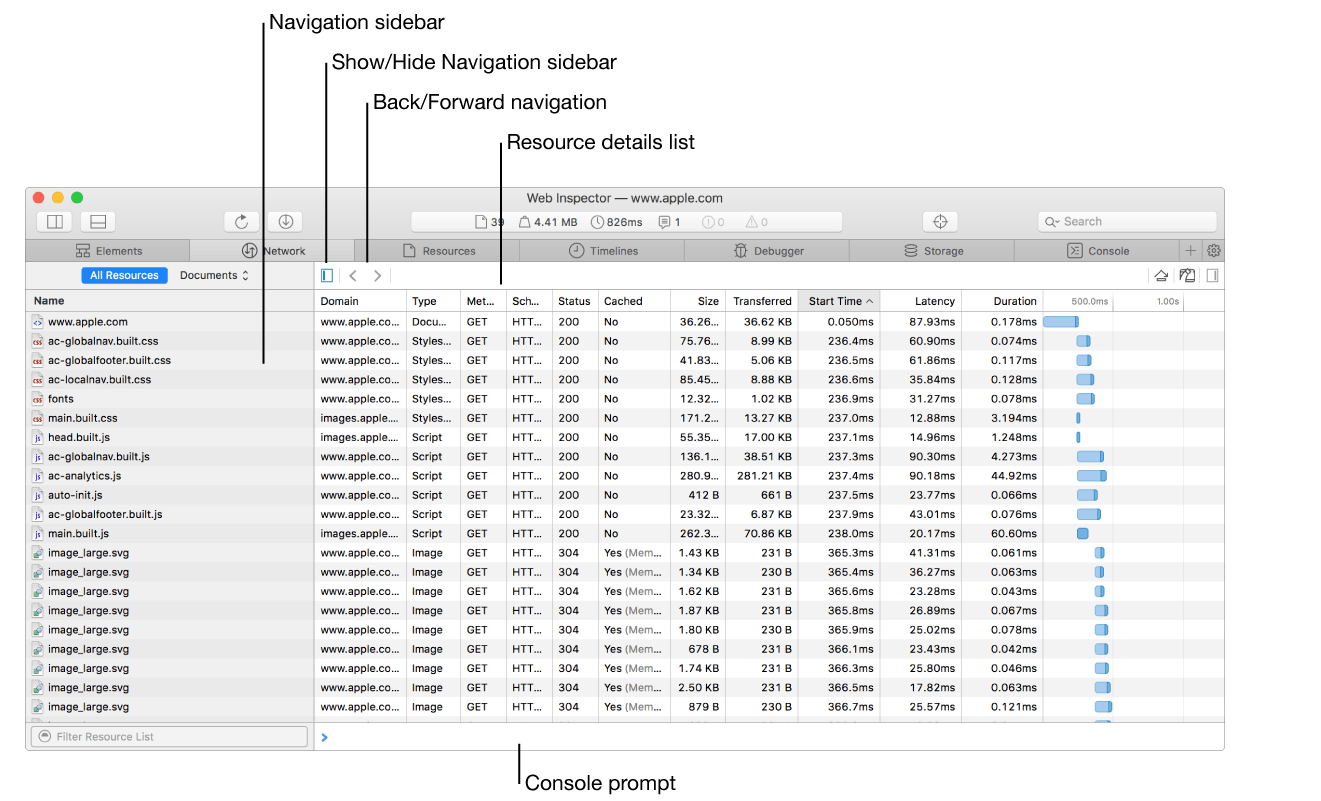
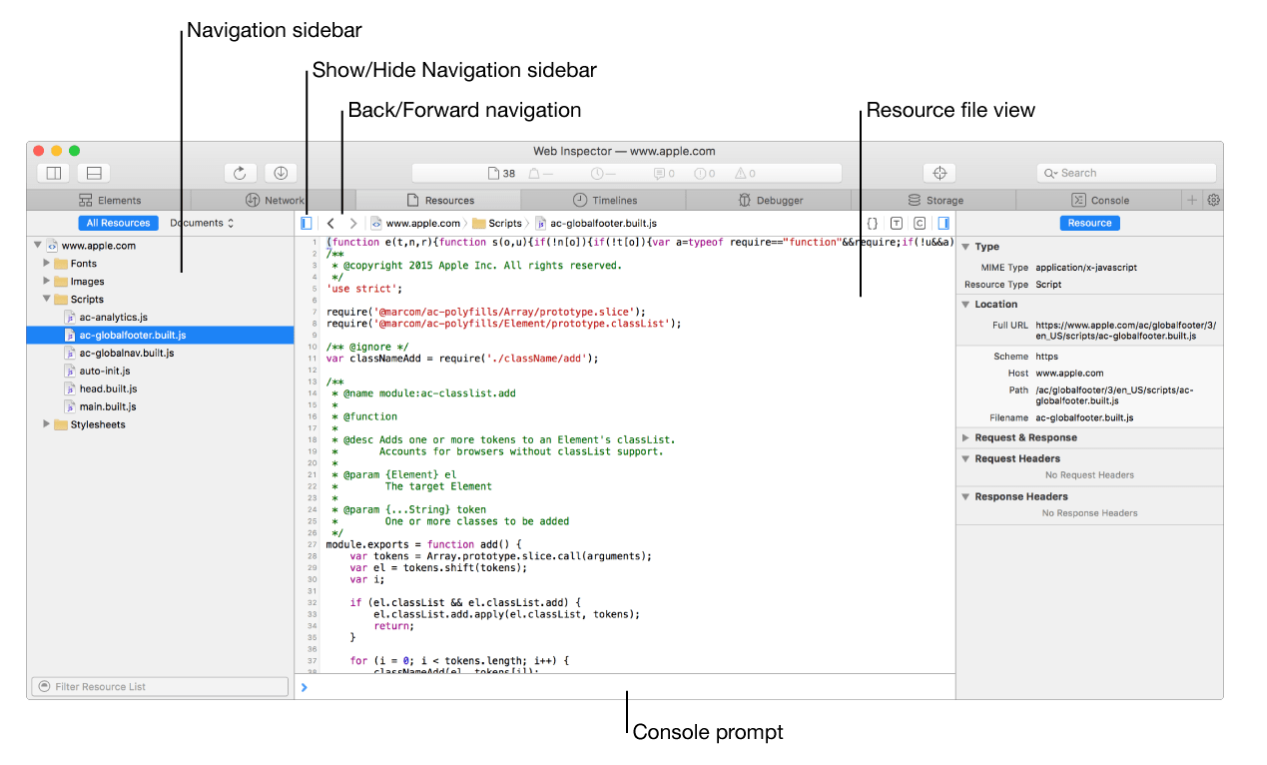
3. Resource tab:
The Resources tab displays all the resources currently being used by web content, even if the content was loaded prior to opening Web Inspector. Resources from prior navigation are not shown.
How a resource is displayed in the main content area depends on the resource's type. The type of a resource is derived from its declared MIME type or inferred from its file extension and contents. Scripts and style sheets are syntax-highlighted. When image and font resources are selected, the main content area shows a preview of the image or font face.
Resource Tab
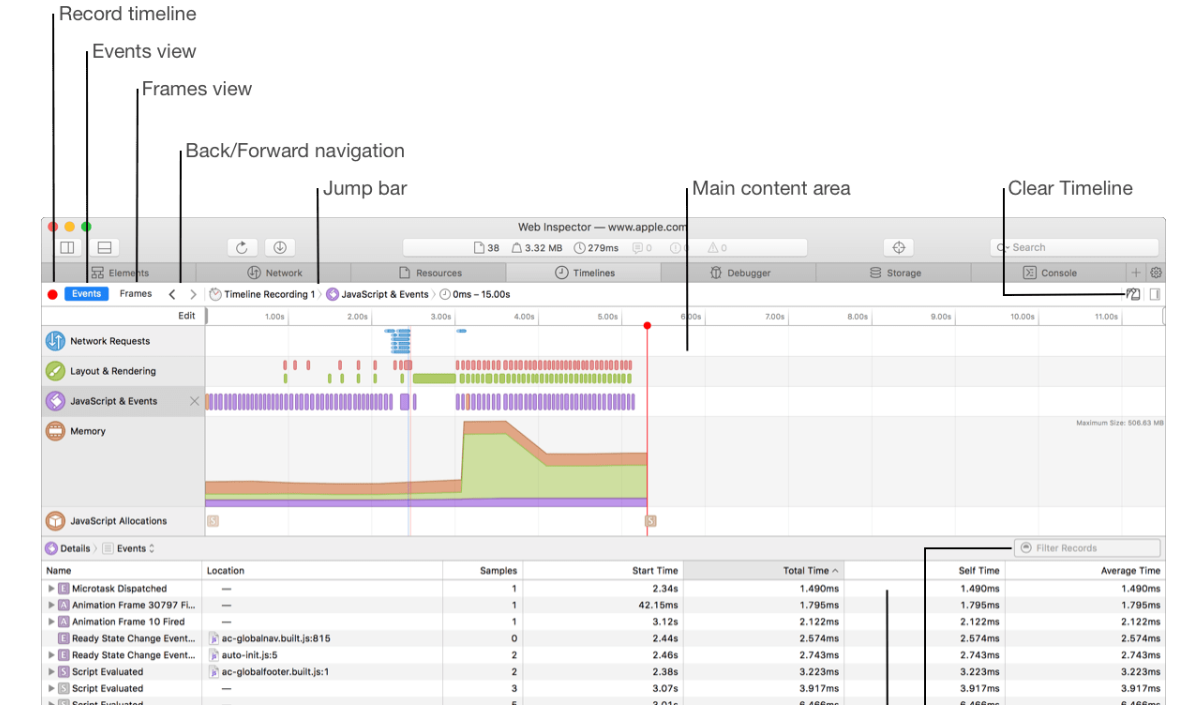
4. Timelines tab:
The Timelines tab provides a time-oriented look at everything that your web content is doing, including networking, JavaScript, rendering, and memory usage.
Timelines Tab
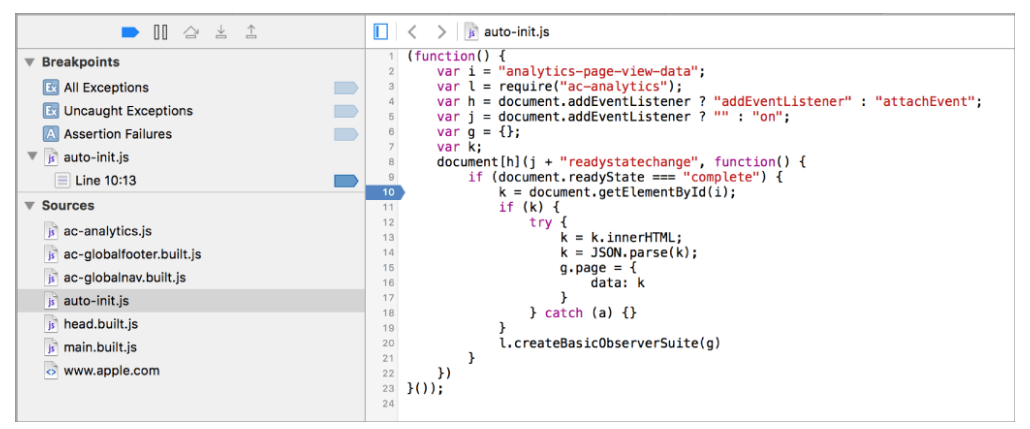
5. Debugger tab:
The Debugger tab lets you examine the execution of JavaScript and observe control flow, variable types, and variable values.
Debugger Tab
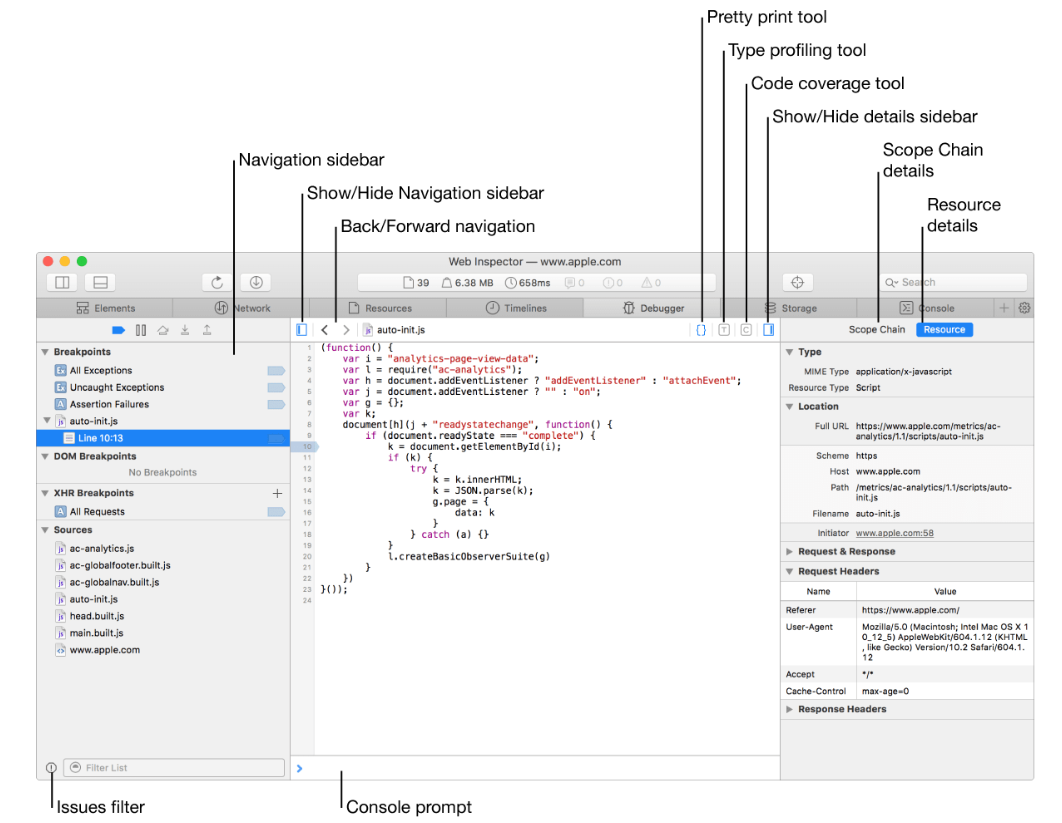
Breakpoints Navigation sidebar
Displays special global breakpoints and JavaScript, DOM, and XHR breakpoints set manually by you. It also has a Sources section, which shows the list of resources in which breakpoints can be set. This excludes CSS, Images, and so on but includes HTML files, which may have inline <script> tags. Warnings, errors, and issues reported by WebKit are shown underneath each resource. These messages are also reported to the Console, but here they are grouped by resource.
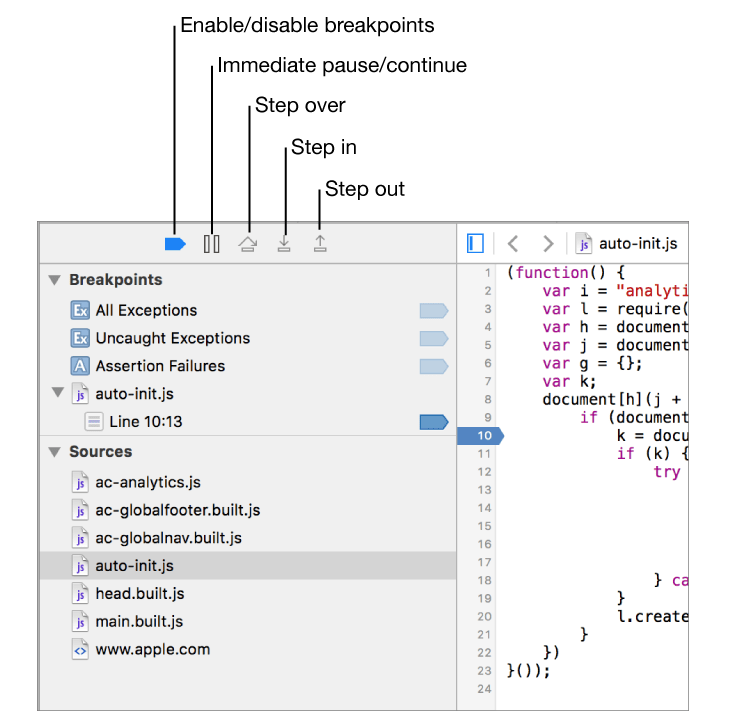
Breakpoint
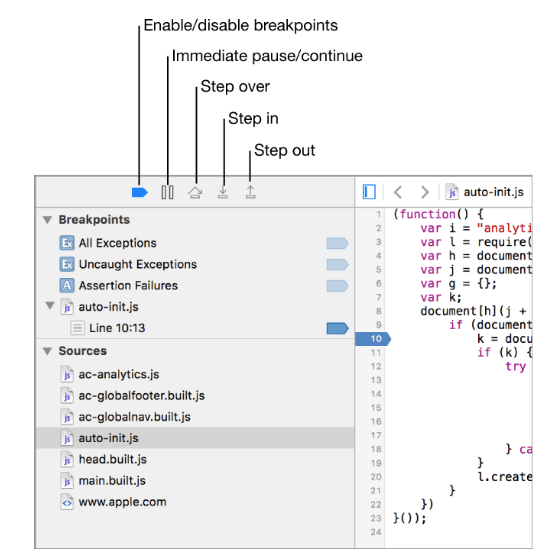
- Enable/disable breakpoints: Completely enables or disables all breakpoints.
- Immediate Pause/Continue: Pauses the debugger at the first statement of the next block of JavaScript that executes. This is typically at a top-level event (from Timelines tab) such as requestAnimationFrame or a DOM event listener.
- Step over: Pauses the debugger at the next expression to be evaluated within the current call frame or its parent frame. It does not descend into callees.
- Step in: Pauses the debugger at the next expression to be evaluated, even if it is within a callee function.
- Step out: Pauses the debugger at the next expression in the caller's call frame. It continues past any remaining expressions in the current call frame.
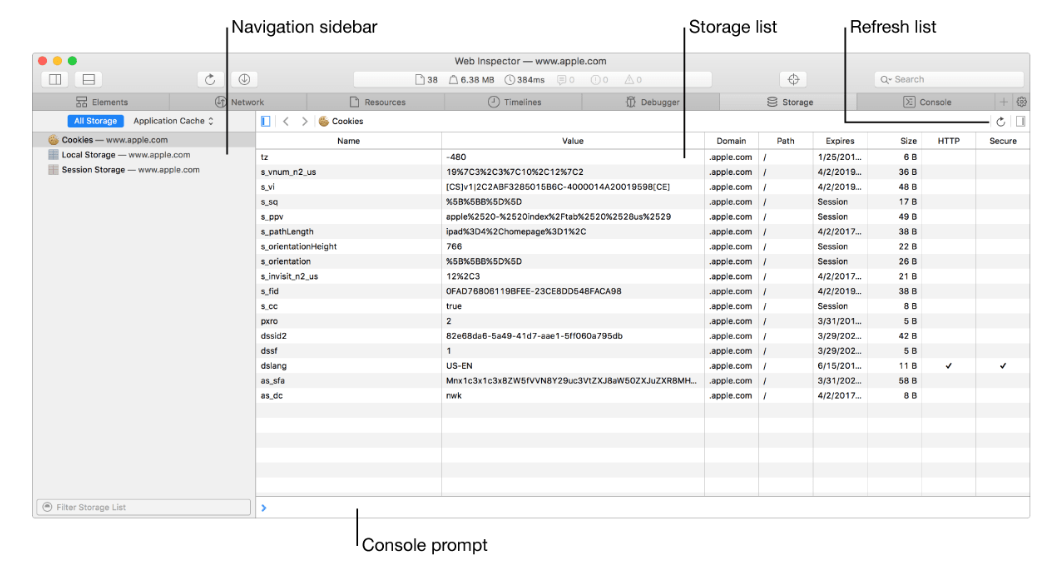
6. Storage tab:
The Storage tab shows a persistent state that is available to web content being inspected. Storage list displays all the values and associated metadata for the selected storage API.
Storage Tab
7. Console tab:
The Console Tab serves two purposes: it shows messages that have been logged by web content, breakpoints, or other features; and it lets you enter and evaluate JavaScript code in the global scope or in the current scope where the debugger is paused.
Editing HTML, CSS and JavaScript:
Web Inspector allows you to edit and save changes to resource files. Editing allows you to preview web content output with adjustments to HTML, CSS, and JavaScript code.
- Elements tab: You can edit an HTML element and edit CSS rules.
- Resources tab: You can edit CSS rules in stylesheet files and edit JavaScript in script files.
Note: You can edit JavaScript files only when if they are local resources
Debugging:
Web Inspector lets you pause code execution, log messages, and catch errors with its debugging tools. Web Inspector debugging tools can be found in the Debugger tab, Resources tab, Console tab.
- Debugger tab: Contains tools to deal with breakpoints. In this tab you can also add a JavaScript breakpoint, edit a breakpoint, add conditions to a JavaScript breakpoint, and step through JavaScript code.
- Resources tab: Contains tools to highlight type and code coverage during code execution.
- Console tab: Allows you to log messages with the console.
1. Add a JavaScript breakpoint
To add breakpoints to your code, do the following:
-
In the left sidebar of the Debugger tab, select a JavaScript or HTML file that contains inline scripts.
-
In the main pane, click the number in the gutter to the left of the code line where you want to create a breakpoint.
-
A dark blue marker is added to the number, indicating that when execution reaches this point, the debugger will pause. The left sidebar lists the breakpoint, its line number, and the resource file it was added to.
Note: The marker is opaque by default, which means the debugger will pause when execution reaches it. If it's medium blue, that means the breakpoint has the "Automatically continue after evaluating" option checked in Breakpoint Options. An even lighter blue means the breakpoint is disabled.
Also, you can edit, disable and delete the breakpoints.
2. Add conditions to JavaScript breakpoints
By adding conditions to JavaScript breakpoints in the Debugger tab, you can limit breaks to specific kinds of executions.
Conditions can be added by:
- In the Debugger tab, Right-click a blue breakpoint marker (in main content pane or in the left sidebar), then choose Edit Breakpoint from the shortcut menu.
3. Stepping through JavaScript code
Use the buttons at the top of the left sidebar in the Debugger tab to navigate through JavaScript code.
When all breakpoints are disabled, or when you’re making a recording with Timeline tab instruments, a message appears at the top of the navigation sidebar to remind you that breakpoints are currently disabled.
When the debugger pauses, script execution is halted, and the next line and expression to be executed are highlighted in the main pane with light and dark green backgrounds, respectively. A green marker is also placed next to the line number gutter for the line currently being evaluated.
When the debugger pauses, the Scope Chain sidebar becomes available in the right sidebar, and the Call Stack section appears in the left sidebar, showing the stack of function calls leading to the current point of execution. When you select a call frame, that source location is revealed in the main content area.
JavaScript Call Stack
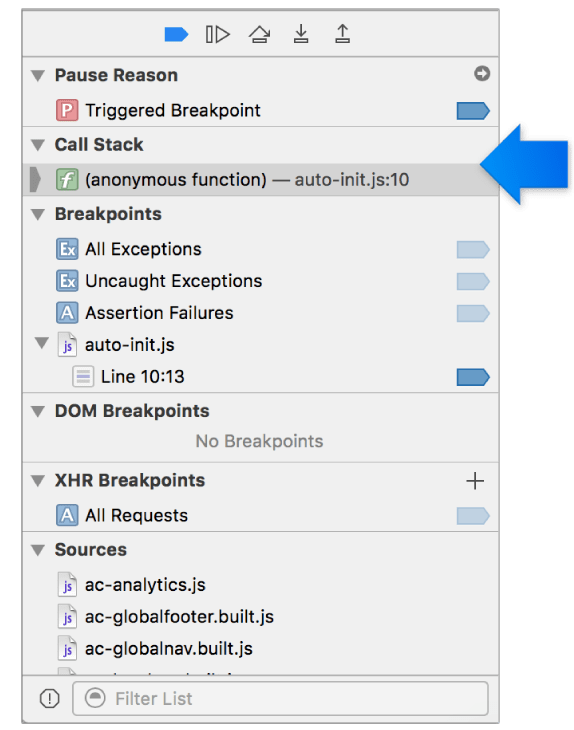
When JavaScript execution is initiated by an asynchronous event, such as a setTimeout firing or a requestAnimationFrame callback, the Call Stack section shows an asynchronous call stack that includes the initiator for the asynchronous event. This allows you to see what ultimately triggered execution of the code where the debugger is paused.
4. XHR breakpoint:
XHR breakpoints pause execution when certain XHR requests are sent by your web content. They’re listed in the XHR Breakpoints section of the left sidebar in the Debugger tab.
Performance Analysis:
Several tools in Web Inspector can help you improve the performance of your web content:
Timelines tab records web events or frames as they’re triggered over time, allowing you to gauge the performance of elements in a website. You can pick and choose multiple instruments that will best help you accomplish your goals. Each instrument has an associated scale for the x-axis. There are 5 potential instruments you can choose to record. They are Network Requests, Layout & Rendering, JavaScript & Events, Memory, and JavaScript Allocations . When you select a instrument, you can see more detail about it in the Details section below the overview of the recording. All instruments have a filter feature in the top corner of the Details section to select for certain records.
Please note that profiling tools store sampling/events information in rendering process while collecting it, which may require a lot of memory. Running profilers for a long time may trigger process hang/crash or even device reboot due to OOM conditions.
1. Analyze resource load time
You can improve resource load time for your web content using the Network Requests instrument in the Timelines tab. The Network Requests instrument visualizes resource loading over time. It is keyed by resource, and shows both the request and response timings within the same row.
After recording a timeline in the Timelines tab, select Network Requests in the sidebar.
Network requests
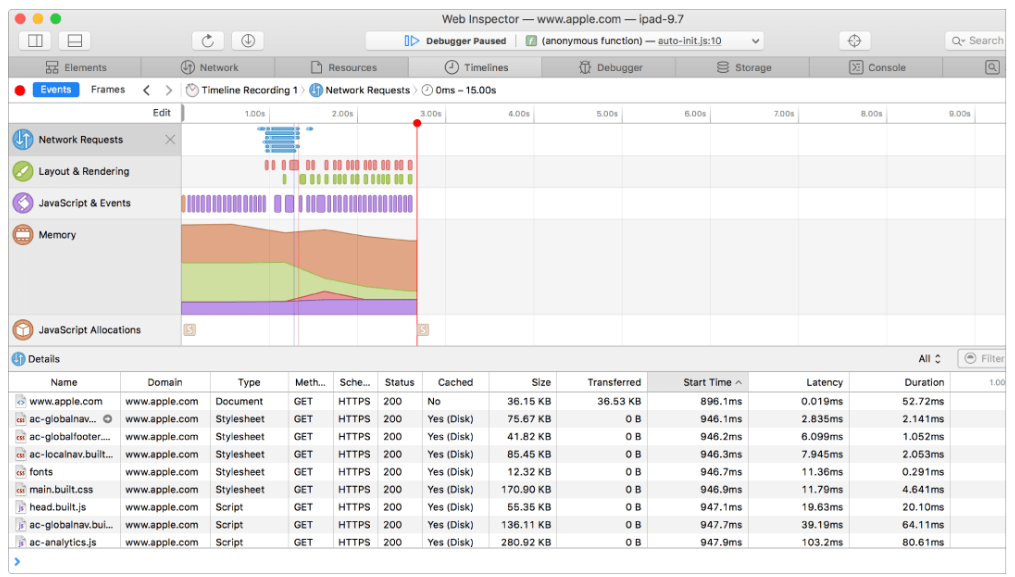
Light blue bars represent time spent sending the request and waiting.
Dark blue bars represent time receiving the response data.
The Details section for this instrument shows statistics for each loaded resource, similar to those shown in the Network tab: how long it took to get each resource, the size of each resource, and the latency of the server.
2. Identifying slow function executions:
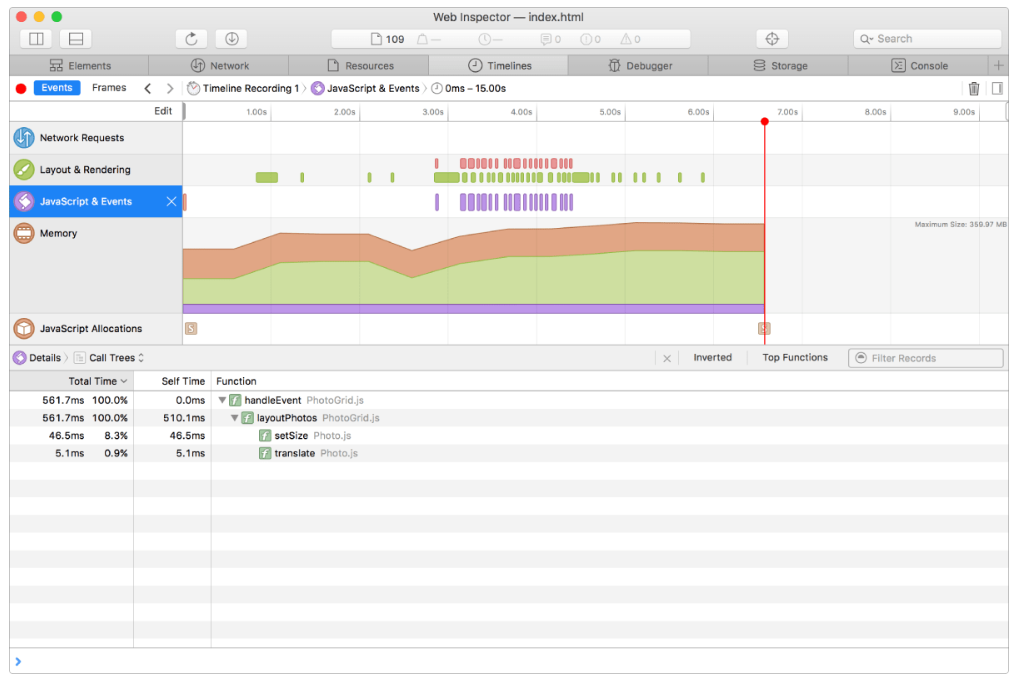
The JavaScript & Events instrument is useful to discover what caused your JavaScript code to run and which functions are taking the most time to run. It displays only the purple JavaScript events triggered and garbage collection events. The sampling profiler captures call stack at regular intervals for the currently executing code.
JavaScript & Events
3. Memory Performance:
You can improve memory performance of your web content by assessing data in the Memory and JavaScript Allocations categories in the Timelines tab.
After recording a timeline in the Timelines tab, select Memory in the sidebar.:
Memory
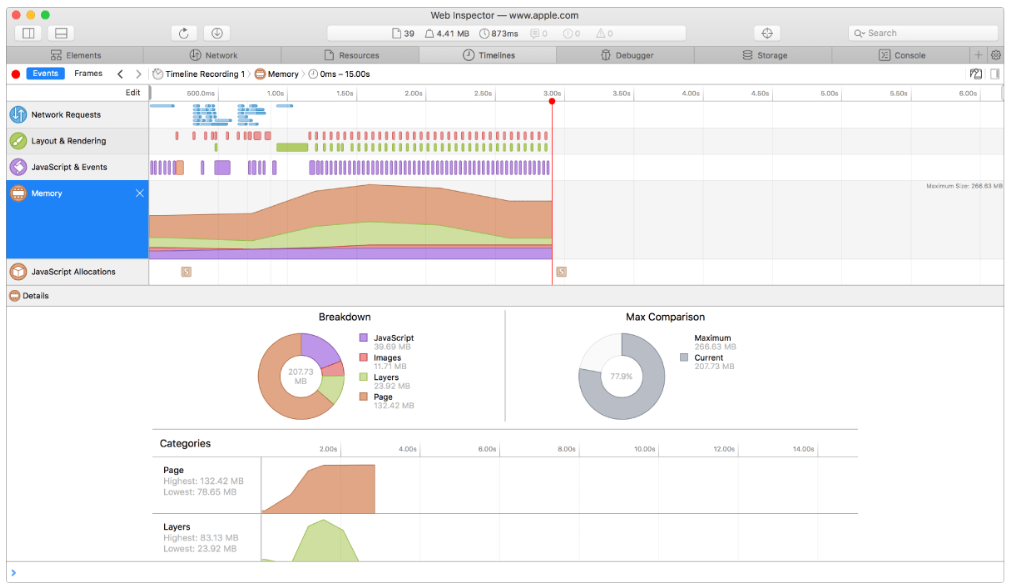
The Memory instrument shows a stacked line graph of relative memory usage over time and the relative memory use of different activities. When you select this instrument, you can see memory usage charts in the Details section.
Each color represents a category of memory use:
-
Purple: JavaScript
-
Red: Images
-
Green: Layers
-
Orange: Page activities
The Breakdown chart shows how much memory is allocated for JavaScript, for images, for the layers, and for the rest of the engine-related page memory such as DOM elements, audio, media, canvas, and so on. The Max Comparison chart shows peak and current memory usage by web content. The Categories section shows line charts of memory usage over time for each category.
4. View JavaScript Allocations Instrument details in the Timelines tab
After recording a timeline in the Timelines tab, select JavaScript Allocations in the sidebar.
The JavaScript Allocations instrument helps you understand which objects use a lot of memory, address memory leaks, find out why an object is still alive, and more.
This instrument and its Details section display heap snapshots (quick captures of the JavaScript heap at specific moments) to show memory usage growing over time. By default, a snapshot is taken when recording starts, every 10 seconds thereafter, and when recording ends. You can also trigger snapshots directly from your JavaScript code with console.takeHeapSnapshot. Adding this statement does not affect the performance of your code; this statement operates only when Web Inspector is open. You can also manually take snapshots during the recording period with the Take Snapshot button.
5. View Layout & Rendering Instrument details in the Timelines tab
The Layout & Rendering instrument helps you understand how time is being spent performing page layout, painting, and compositing. The timeline contains markers to denote times when lots of layout and rendering tasks were performed, and can stretch to include many discrete tasks listed in the data table.
Layout & Rendering
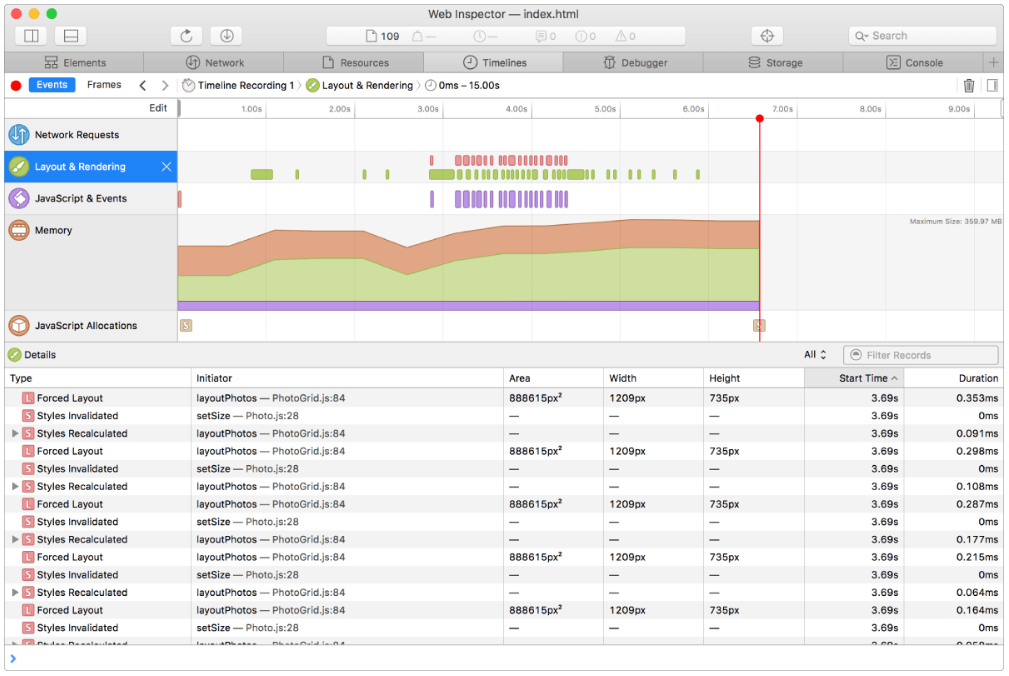
The Layout & Rendering row in the timeline contains markers that show when rendering and layout events took place. There are two kinds of markers:
-
Red markers are used for CSS cascade and page layout events.
-
Green markers are used for painting and compositing events.
In the data table, layout and rendering tasks are shown with their start time and duration. This allows you to find the most expensive operations and investigate those first.
Each paint task has an associated size and position; selecting a paint record in the data table highlights the region that was painted in the inspected web content.
Layout and forced layout tasks include a region that bounds the extent of the page that is affected by the layout. In some situations where layout is directly caused by a JavaScript call, layout tasks include a call stack in the Initiator column. To see the full call stack and jump to source locations that led to a layout task, select the record and move the pointer over the Initiator cell.
Screenshots were taken using the Safari browser.